 Sarucci
Clarity360 · Business intelligence
Every number that runs your hotel. One login.
From your 4-KPI morning glance to a 360° command view of 40 KPIs across your entire operation, built for GMs, owners, asset managers and portfolio managers.
Overview Dashboard
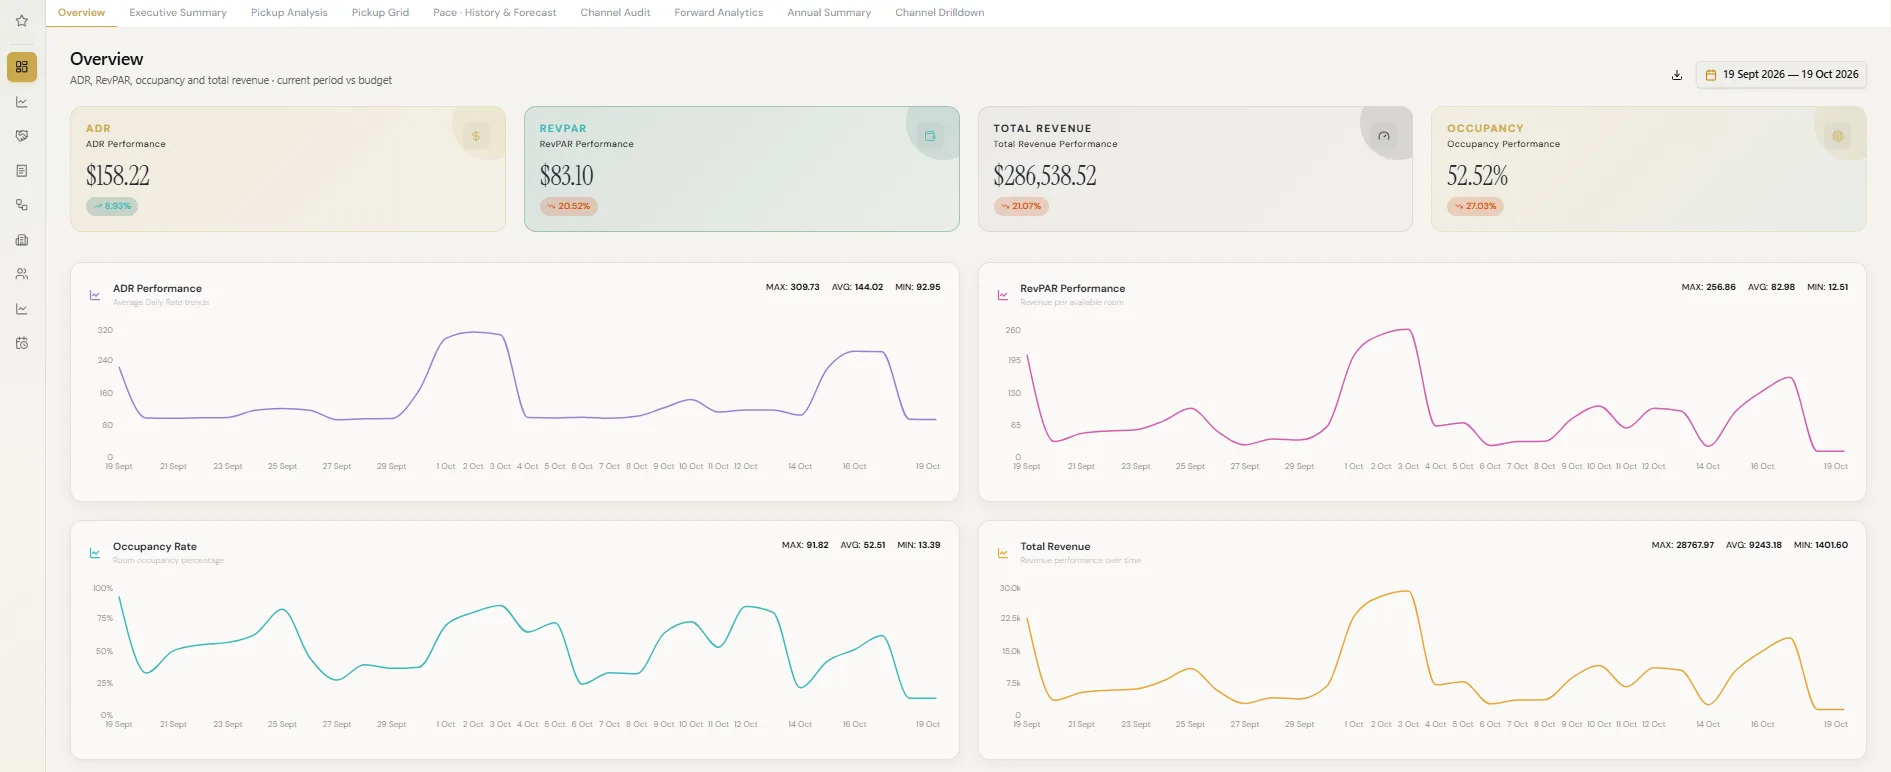
Your morning in one glance: ADR, RevPAR, Revenue and Occupancy for any date range, each with % variance against budget so you always know if you're ahead or behind.
- Aggregated KPI cards for any selected date range
- % comparison against budget on every KPI
- Daily performance line charts with maximum, average and minimum per KPI
360° View, 40 KPIs, one screen
Commercial, financial, operational, HR, costs, reputation and guest-behavior data on a single screen. The bird's-eye view that gives GMs, owners, asset managers and portfolio managers their hours back.
- 40 KPIs spanning Commercial, Financial and Operational performance
- Portfolio bird's-eye with one-click drill-down
- Built for owner reporting without the spreadsheet marathon

Channel Map
Select all channels or one, pick a month, and see the true economics of every booking source.
- Total revenue, average ADR, average booking value
- Booking cost, the commission you actually pay per channel
- Net revenue, total bookings, average length of stay, cancellation rate

Revenue Lens
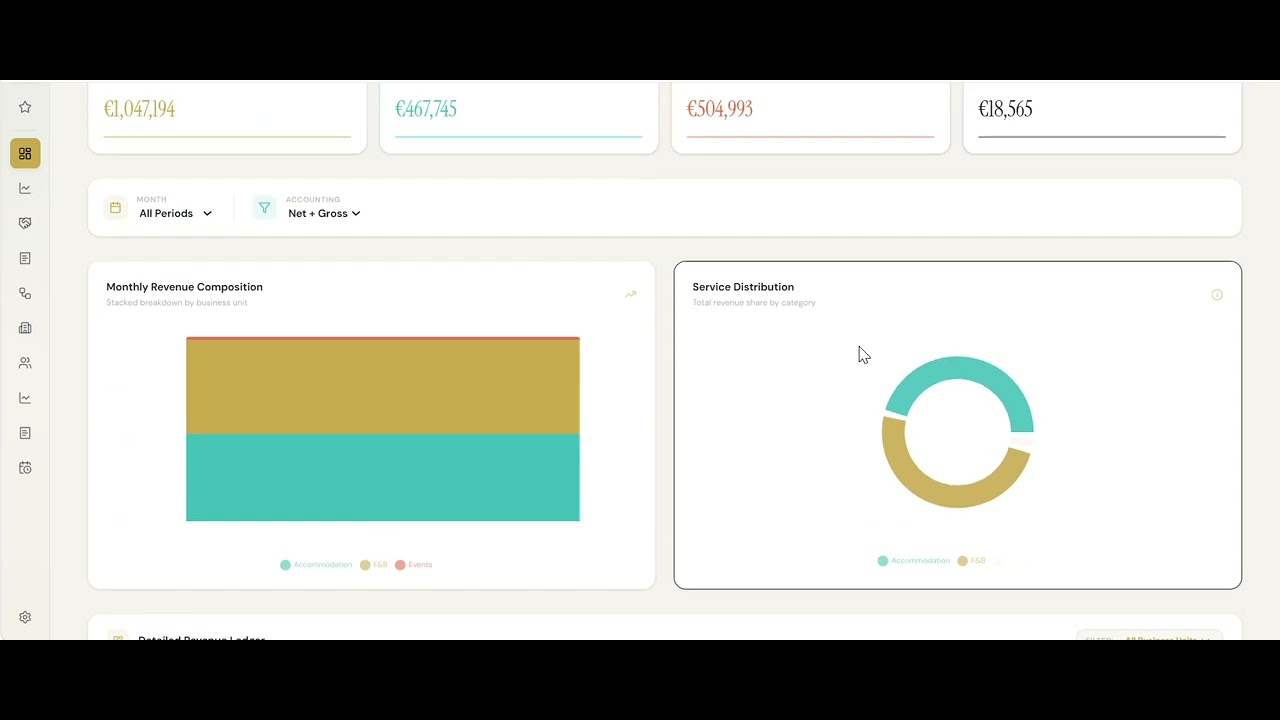
The full revenue picture beyond rooms: Accommodation, F&B, Events and other revenue broken down, stacked by month, and traceable to the ledger line.
- Total / Accommodation / F&B / Events and other revenue breakdown
- Monthly revenue composition, stacked by business unit
- Service distribution, revenue share by category
- Detailed revenue ledger with business-unit and month filters, net and gross
Ask Zaki
Type "show me weekend ADR vs budget by month", and the chart appears. Natural-language KPI cards and charts, built on request, no analyst required.

KPI Library
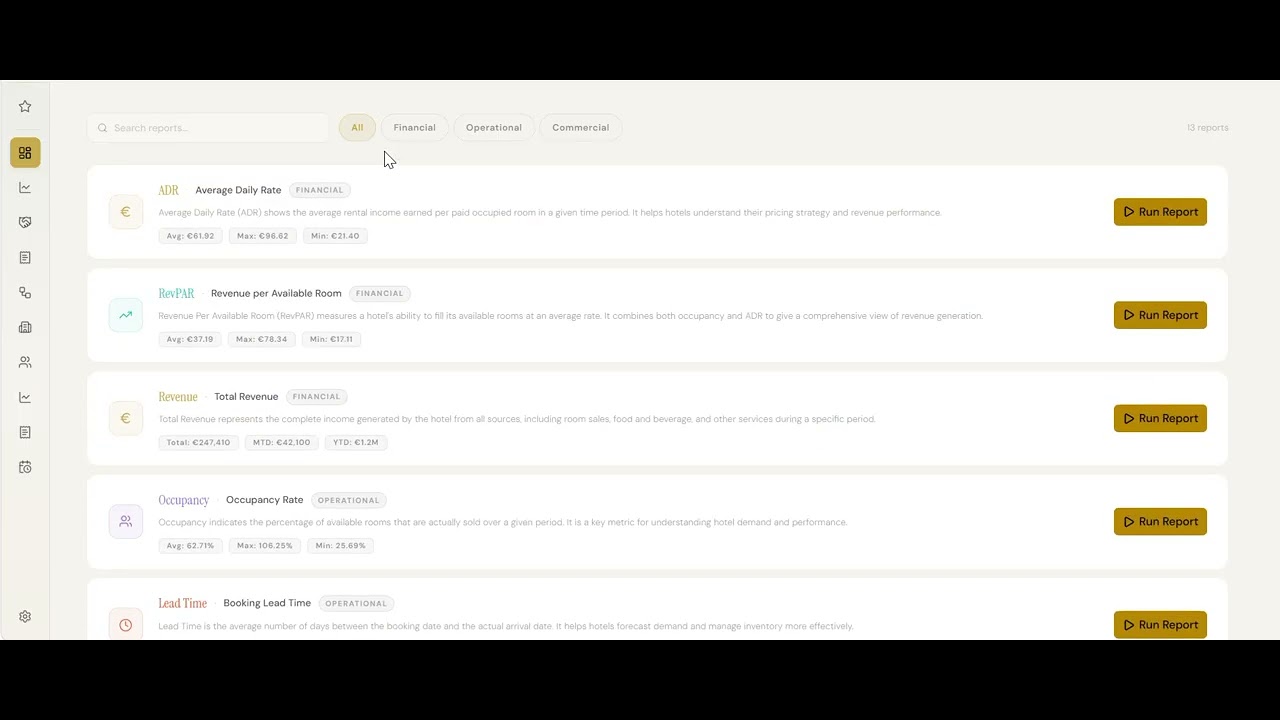
Behind every KPI sits a dedicated drill-down report, organised across financial, operational and commercial, so "why?" is always one click from "what".
"One property or forty, same screen."
Modular by design
Clarity360 is available standalone, bundle with Sarucci Agents and save.
Questions, answered
FAQ
Where does Clarity360 get its data?
Directly from your PMS via API (Opera Cloud, Mews, Cloudbeds or Apaleo today), enriched with your budget upload and, where enabled, Price Radar market data.
How often does the data refresh?
Automatically throughout the day via your PMS connection, so the morning view is genuinely this morning's view.
Can I upload budgets?
Yes, budgets load per KPI and per period, and every card shows live variance against them.
Does it roll up across properties?
Yes. The 360° View aggregates a portfolio to a bird's-eye view with one-click drill-down into any property.
See your hotel in Clarity360.
Get a free revenue audit and a walkthrough on your own numbers.
Free instant revenue audit · Live in 90 minutes · Smart Pricing recommendations within 48 hours